

Can your Oura, Garmin, Fitbit, or Apple Watch predict Hormone Trends?
Imagine you wake up and instead of peeing in a cup and spending your time, energy, and hundreds of dollars on hormone testing, your smart device, be it an Oura ring or a Fitbit tells you what your hormones look like. Why is this not happening yet? Don’t have an answer but it is very much doable. And like me, if you want to see this dream become a reality, please support us in this movement of coding female biology to make women’s health more accessible and understandable.
At Whuman, we have built FOR THE FIRST TIME EVER a model that can predict dominant hormones from the data collected using wearable devices used by women. It’s not perfect but definitely a good starting point. The credit however goes to the orchestrators and authors of this one study called MCphases (Lin et al., 2025, PhysioNet) who collected a dataset that could be used to make these predictions. And with your help and support we will aim to make these predictions as accurate as possible.
Here are the APIs you can use for your respective smart devices. Please give it a try and let us know what you think. Alternatively, you can also upload exported csv file or raw values.

For people who want to understand the science of how this is possible, here is the spiel:
In women (and men), our hormones influence our physiology and our nervous system. The smart device readouts like heart rate, HRV, and even skin temperature are heavily influenced by our hormones. It is very well known that these readouts change in women when they are in different phases of their menstrual cycle. Studies have shown that resting HR increases and HRV decreases in the luteal phase compared to the follicular phase, and skin temperature rises approximately 0.3°C post-ovulation due to progesterone, which is something Oura already uses for cycle tracking. However, everyone is so fixated in accurately cycle tracking or defining the phases of the menstrual cycle that they are overlooking the underlying hormones and their contribution to these physiological readouts.
Look at this analysis of Fitbit readouts and hormone levels measured using Mira tracker from MCphases.
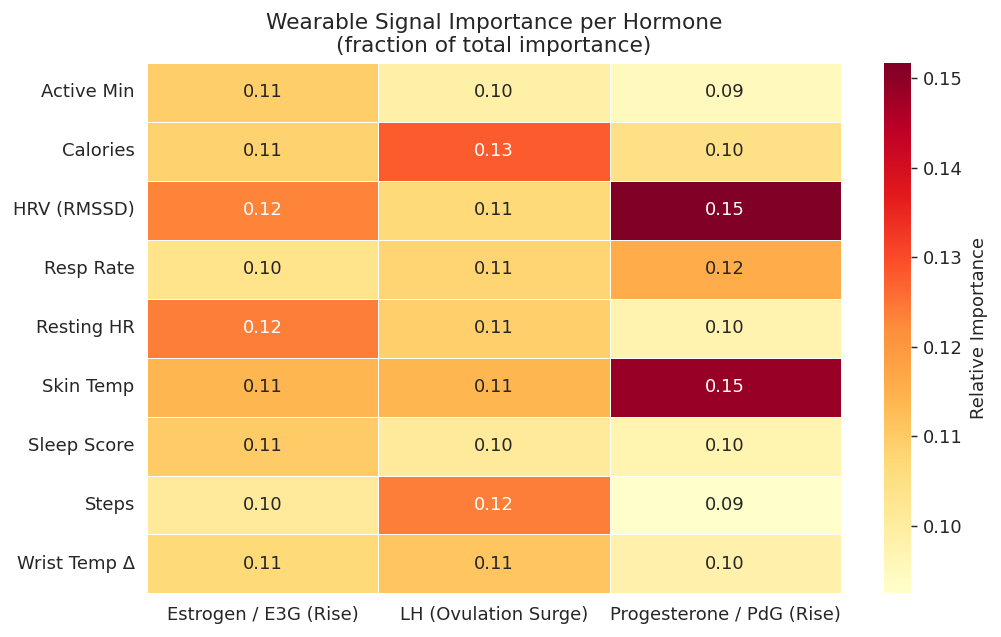
Fraction of total random-forest feature importance attributed to each wearable signal. Higher = that signal's trend
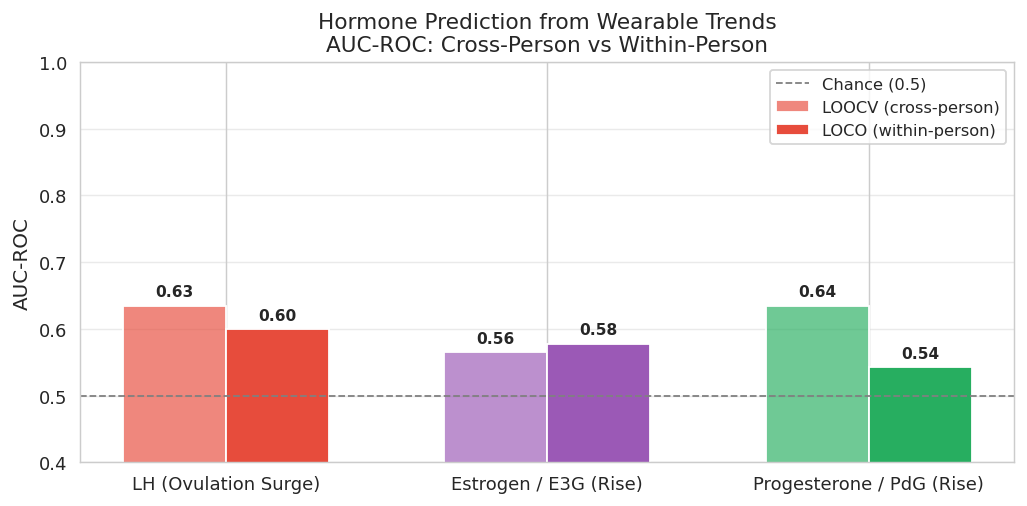
AUC-ROC measures ranking ability (0.5 = chance, 1.0 = perfect). ≥0.75 is clinically useful; 0.65–0.75 informative trend signal; <0.65 weak.
Even though the sample size is small and ranking ability is borderline weak (a known limitation across women’s health research, and exactly why datasets like MCphases matter and why we need more), there is a clear correlation between Resting HR, HRV, and skin temperature and the 3 hormones. Yes, you can use this data for defining different cycle phases, but what about women like me who have PCOS/PMOS or women who have perimenopause who are not having regular cycles? Cycle phase models assume regularity. Hormonal models don’t. They work with whatever your body is doing that day. Cycle phase prediction is useless for us but dominant hormone prediction can be very useful in making sense of our symptoms. Am I estrogen dominant? Is my LH always high? Is my progesterone always low? And only 3 hormones have been measured so far, but with additional data, the complexity of female biology can actually be coded to make sense of our ever-changing body.